Mining Production KPIs: Formulas Built on the GMG Time Usage Model
Understand mining production KPIs using the GMG Time Usage Model, including availability, utilization, downtime, and productivity formulas.
Mining teams rely on production KPIs to understand whether equipment and processes are delivering expected results.
However, KPI values are only useful when everyone measures time and performance using the same definitions.
A mine reporting 85% equipment availability may appear highly efficient. But another operation reporting the same number may calculate availability differently, making comparisons unreliable.
This is the challenge the Global Mining Guidelines Group (GMG) Time Usage Model addresses.
By creating a standardized framework for classifying equipment time, the model helps mining companies measure availability, downtime, utilization, and productivity using consistent definitions.
For operations teams, this creates a clearer picture of where production time is gained, lost, and improved.
Key Takeaway
Mining production KPIs based on the GMG Time Usage Model help operations teams understand how equipment time is distributed across availability, downtime, standby, and operating periods. When combined with production metrics such as tonnes per hour, these KPIs reveal the real causes behind productivity losses.
Why the GMG Time Usage Model Matters for Mining KPIs
Mining equipment performance depends heavily on how time is classified.
Without a standard model, two sites may report the same KPI but measure different things.
For example:
- One mine may include standby time within operating availability.
- Another may remove standby before calculating utilization.
Both may report similar percentages, but the operational meaning is different.
The GMG Time Usage Model provides a common structure by separating different categories of equipment time and the losses between them.
This helps mining teams compare performance, identify constraints, and improve operational efficiency.
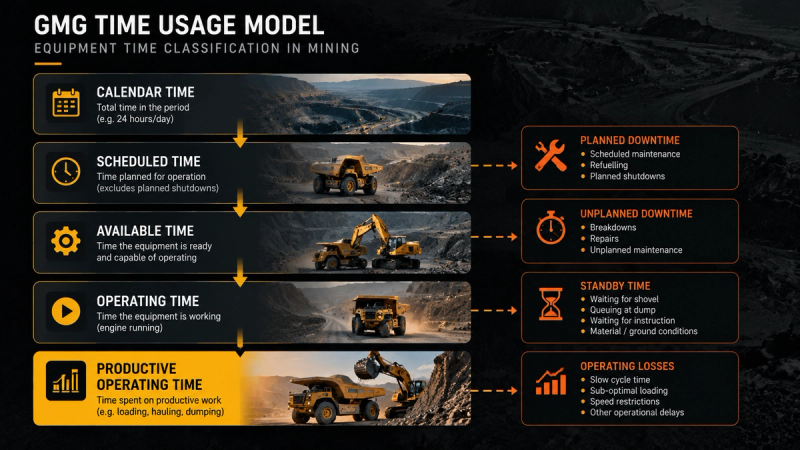
Understanding Mining Time Categories Through the GMG Model
The GMG Time Usage Model breaks equipment time into categories by removing different types of losses.
Time Category | Meaning | Loss Removed | Mining Example |
|---|---|---|---|
Calendar Time | Total time available in a calendar period | None | 24 hours in a day |
Scheduled Time | Time planned for equipment operation | Unscheduled time | Planned operating shift |
Available Time | Time equipment is ready for operation | Downtime | Truck available after repair |
Operating Time | Time equipment is actively working | Standby time | Truck hauling material |
Productive Operating Time | Time contributing directly to production | Operating delays | Truck moving planned tonnes |
This structure helps teams understand whether lost production comes from:
- Equipment reliability
- Operational delays
- Poor utilization
- Process constraints
Mining KPI Formulas Teams Should Track
Physical Availability
Physical availability measures how much of the total calendar time equipment is available for operation.
Formula:
Physical Availability (%) = (Calendar Time - Downtime) ÷ Calendar Time × 100
Example:
A haul truck has:
- Calendar time: 24 hours
- Downtime: 3 hours
(24 - 3) ÷ 24 × 100 = 87.5%
This helps reliability teams understand how much time is lost due to equipment condition.
Utilization
Utilization measures how effectively available equipment time is being used.
Formula:
Utilization (%) = Operating Time ÷ Available Time × 100
Example:
A truck is available for 18 hours but operates for 15 hours:
15 ÷ 18 × 100 = 83.3%
Low utilization may indicate:
- Waiting time
- Dispatch issues
- Material availability problems
- Poor coordination
Production Rate
Time-based KPIs must connect with actual production output.
Formula:
Production Rate = Tonnes Moved ÷ Operating Hours
Example:
A truck fleet moves:
- 20,000 tonnes
- During 10 operating hours
20,000 ÷ 10 = 2,000 tonnes per hour
This helps teams understand whether equipment time is converting into production.
Why Availability Alone Does Not Define Productivity
A common mistake is assuming higher availability always means better performance.
Consider two haul trucks:
KPI | Truck A | Truck B |
|---|---|---|
Availability | 95% | 88% |
Utilization | 70% | 85% |
Tonnes Moved | 8,500 | 10,200 |
Truck A appears better because it is available more often.
However, Truck B delivers higher production because available time is being converted into productive operation more effectively.
This is why mining teams need multiple mine productivity metrics instead of relying on a single KPI.
Reading KPI Signals to Find Operational Problems
Production KPIs become valuable when they help teams diagnose problems.
KPI Pattern | Possible Cause |
|---|---|
High availability + low utilization | Equipment waiting, dispatch issues, workflow constraints |
High utilization + low production | Cycle time problems, payload issues, operating delays |
Low availability | Maintenance issues, reliability problems |
High standby time | Planning gaps, demand imbalance, operational constraints |
For example, high downtime may require maintenance improvements. High waiting time may require operational changes instead.
Understanding unplanned equipment downtime in mining helps teams separate reliability problems from operational inefficiencies.
Maintenance KPIs That Support Production Analysis
Production performance is closely connected to equipment reliability.
Important maintenance KPIs include:
Mechanical Availability
Measures equipment readiness from a mechanical perspective by focusing on equipment condition and repair-related losses.
Mean Time Between Failures (MTBF)
Measures the average operating time between equipment failures.
Higher MTBF generally indicates improved reliability.
Mean Time To Repair (MTTR)
Measures the average time required to restore equipment after failure.
Lower MTTR helps reduce downtime impact.
These metrics help maintenance and operations teams work together instead of viewing equipment performance separately.
How Real-Time Operational Intelligence Improves KPI Tracking
Traditional KPI reporting often happens after a shift ends.
By then, production losses have already occurred.
Real-time operational intelligence helps mining teams monitor:
- Utilization changes during a shift
- Increasing standby time
- Equipment delays
- Production performance against plan
For example, if truck utilization starts declining during a shift, teams can investigate whether the cause is dispatch imbalance, loading delays, or equipment constraints.
Learn more about real-time operational intelligence in mining.
Short Interval Control processes can further help teams review these KPI changes and take corrective action during active operations.
Using AI to Improve Mining Production Optimization
AI mining software can help teams analyze KPI trends and identify hidden performance losses.
Examples include:
- Detecting increasing standby time patterns
- Identifying repeated delay causes
- Predicting production shortfalls
- Highlighting equipment performance changes
Instead of reviewing KPIs only after targets are missed, AI can help teams recognize operational risks earlier.
Learn more about AI in open-pit mining operations.
Turning Mining KPIs Into Better Decisions
Mining production KPIs are not just numbers on a dashboard.
They provide insight into how effectively equipment, people, and processes work together.
The GMG Time Usage Model creates the foundation for consistent measurement. When combined with real-time visibility and operational intelligence, these metrics help mining teams identify losses, improve utilization, and optimize production.
For operations looking to improve throughput, Guaranteed Production Throughput helps teams focus on identifying and reducing operational constraints.
HonestDig helps mining operations connect data, performance metrics, and decisions to improve productivity and operational efficiency.
Frequently Asked Questions
What is the GMG Time Usage Model in mining?
The GMG Time Usage Model is a standardized framework for classifying mining equipment time into categories such as calendar time, scheduled time, available time, and operating time. It helps mining companies measure equipment performance consistently.
What are the most important mining production KPIs?
Important mining production KPIs include physical availability, utilization, production rate, cycle time, downtime, standby time, tonnes moved per hour, and equipment reliability metrics.
Why is equipment availability not enough to measure mine productivity?
Equipment can have high availability but still produce less if it experiences waiting time, poor utilization, dispatch issues, or operational delays.
How does the GMG Time Usage Model improve KPI accuracy?
The model creates consistent definitions for equipment time categories, allowing mining teams to compare performance accurately across sites and operations.
How can AI improve mining KPI tracking?
AI can analyze operational KPI trends, identify patterns, detect risks, and help teams improve production decisions using real-time operational data.