Mining Availability Benchmarks 2026: Copper, Coal & Iron
Compare 2026 mining equipment availability benchmarks for copper, coal and iron ore fleets, with practical ranges and calculation guidance.
Mining Downtime and Availability Benchmarks 2026 for Copper, Coal and Iron Ore
Compare practical equipment availability ranges and learn why copper, coal and iron ore mines must interpret the same percentage differently.
Two mines can report 90% equipment availability and face completely different operating conditions.
At the first mine, planned maintenance is included, technology faults are visible and downtime starts when the truck stops. At the second, scheduled maintenance and communication failures are excluded.
Both reports show 90%, but only one reflects the equipment capacity actually available to production.
This is the central problem with mining equipment availability benchmarks. The percentage means little until the mine defines what counts as scheduled time, downtime and an available asset.
Key Takeaway
For mature large mining equipment, 88% to 92% physical availability is a practical reference range. Performance between 92% and 94% can indicate a leading fleet, but only when planned maintenance, unplanned failures and relevant technology downtime remain visible. Copper, coal and iron ore mines should use these ranges as starting points, then adjust comparisons for fleet age, operating conditions and production constraints.
What Is Equipment Availability in Mining?
Equipment availability measures the percentage of scheduled time that a machine is capable of operating.
A common physical availability formula is:
Physical availability = (Scheduled time − Total downtime) ÷ Scheduled time × 100
If a haul truck is scheduled for 24 hours and unavailable for 2.4 hours, its physical availability is 90%.
The complication is “total downtime.” Some mines include planned maintenance, waiting for parts and onboard technology faults. Others exclude one or more of these categories.
Before comparing two fleets, confirm that both use the same calculation.
Metric | What it measures | What it can reveal |
|---|---|---|
Physical availability | Time equipment is capable of operating | Total capacity available to production |
Mechanical availability | Readiness after defined mechanical downtime | Maintenance and reliability performance |
Utilisation | Time available equipment actually operates | Dispatch, labour and production constraints |
MTBF | Operating time between failures | Failure frequency |
MTTR | Average repair duration | Repair and recovery speed |
Availability should always be reviewed with mining equipment maintenance KPIs, especially MTBF, MTTR and utilisation.
Mining Equipment Availability Benchmarks for 2026
Published mining equipment guidance places strong large-machine performance around 88% to 92% physical availability. A recent mining equipment availability guide describes 92% to 94% as world-class haul truck performance.
These figures should not be treated as universal targets. Availability varies by machine class, fleet age, operating environment and calculation method.
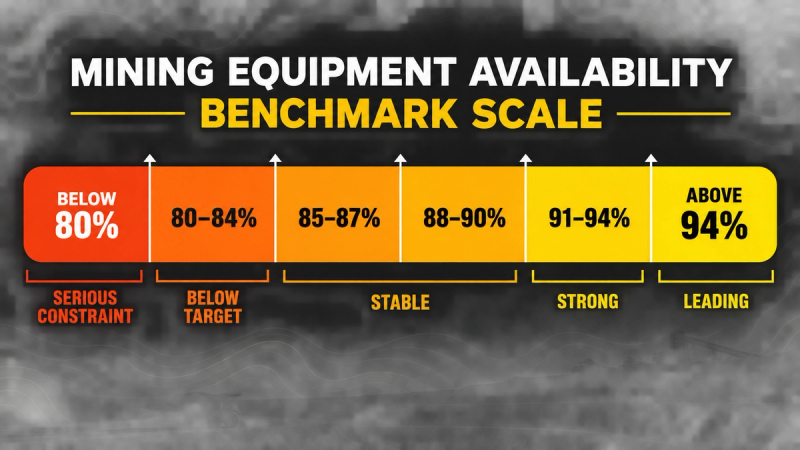
For practical evaluation, use the following bands:
Physical availability | Practical interpretation | Unavailable time per 24 hours |
|---|---|---|
Below 80% | Serious reliability or maintenance constraint | More than 4.8 hours |
80% to 85% | Below expected performance | 3.6 to 4.8 hours |
85% to 88% | Stable, with clear improvement potential | 2.9 to 3.6 hours |
88% to 92% | Strong performance for a mature fleet | 1.9 to 2.9 hours |
92% to 94% | Leading performance if definitions are complete | 1.4 to 1.9 hours |
Above 94% | Possible, but exclusions should be checked | Less than 1.4 hours |
A trustworthy 90% is more valuable than a reported 94% built on exclusions.
Copper Mine Availability Benchmarks
Large open-pit copper mines often face changing equipment conditions as the pit develops. Haul distances increase, ramps become longer and trucks spend more time travelling under load.
At high-altitude operations, reduced air density and difficult cooling conditions can place additional pressure on engines, braking systems and tyres. Heat, dust and road conditions add further variation.
An 88% to 92% reference remains useful, but a copper mine should compare:
- Similar truck classes and ages
- Similar pit depths and haul profiles
- Comparable altitude and temperature conditions
A fleet operating in a deep, high-altitude pit should not be judged directly against a younger fleet working shorter hauls near the surface.
The more useful comparison is the same fleet over time, adjusted for changes in haul distance, pit depth and operating environment.
Coal Mine Availability Benchmarks
Coal operations require a different comparison structure because overburden removal and coal movement may involve separate fleets, contractors and production priorities.
A mine can report acceptable site-level availability while one contractor fleet or the overburden fleet remains a persistent constraint. Owner-operated and contractor-managed equipment should therefore be reported separately.
A published Komatsu case study from a large Indonesian coal mine used approximately 80% availability in its operating assumptions. That figure belongs to one site and should not be treated as a coal-sector benchmark, but it shows why real operating baselines can sit below a generic target.
The mine’s conditions, equipment and reporting rules still determine what improvement is realistic. The Komatsu coal mine case study also demonstrates how availability assumptions connect with fuel and operating-cost calculations.
Coal mines should benchmark at least three groups independently:
- Overburden equipment
- Coal-production equipment
- Contractor-managed fleets
Weather, haul-road conditions and seasonal interruptions should remain visible in the supporting downtime analysis.
Iron Ore Mine Availability Benchmarks
Iron ore mines often operate as part of a tightly connected production chain. Trucks, crushers, conveyors, rail and port infrastructure all influence whether equipment availability becomes saleable production.
Autonomy adds another important distinction. Rio Tinto reports that approximately 90% of its Pilbara haul truck fleet is autonomous. This is not an availability percentage, but it shows why manned and autonomous fleets should not be placed in one undifferentiated benchmark.
Rio Tinto’s Western Australian operations also connect mines, rail and shipping terminals through an integrated operating network.
An iron ore operation should therefore compare:
- Autonomous and manned haul fleets separately
- Mobile-equipment availability against crusher and rail constraints
- Individual mine performance against the wider production chain
A truck fleet can achieve 92% availability without improving shipments if the crusher, rail system or port is already limiting throughput.
Why Availability Alone Can Mislead
Two fleets can report the same availability while carrying different reliability risks.
Consider this simple example:
Fleet | MTBF | MTTR | Indicative inherent availability |
|---|---|---|---|
Fleet A | 40 hours | 4 hours | 90.9% |
Fleet B | 80 hours | 8 hours | 90.9% |
Fleet B fails half as often, but each repair takes twice as long.
Fleet A needs stronger failure prevention. Fleet B may need better repair planning, parts readiness or specialist support.
Availability alone hides this difference. Review it alongside MTBF, MTTR, utilisation, production tonnes and the cost of unplanned mining downtime.
Worked Example: What a Two-Point Improvement Means
Consider a fleet of 40 haul trucks scheduled for 24 hours per day.
At 90% availability:
40 × 24 × 10% = 96 unavailable truck-hours per day
At 92% availability:
40 × 24 × 8% = 76.8 unavailable truck-hours per day
The two-point improvement returns:
96 − 76.8 = 19.2 truck-hours per day
That equals 9.6 additional truck-hours during each 12-hour shift.
However, additional availability does not automatically become extra tonnes. The mine must have loading capacity, operators, suitable haul roads and downstream capacity available to use those hours.
How to Standardise Mining Downtime Codes
Reliable benchmarking starts with consistent event classification.
- Create mutually exclusive equipment states. Use a short top-level structure such as operating, standby, planned maintenance, unplanned mechanical downtime, operational delay and technology or network delay.
- Set one timing rule. Define exactly when downtime begins, when it ends and who owns the final classification. Apply the rule across dispatch, maintenance and contractor teams.
- Review unclear events weekly. Investigate “other” and “unknown” codes before they become permanent reporting gaps. The same event should receive the same code across every fleet and site.
This process makes trends comparable and prevents performance from appearing to improve simply because downtime moved into an excluded category.
Benchmark Availability Without Hiding the Problem
Start with the 88% to 92% reference range, but compare like with like. Separate fleets by asset class, age, operating role, autonomy status and contractor ownership.
Then connect availability to the operational outcome. Ask whether higher availability increased tonnes, reduced queues or lowered standby time. If it did not, the constraint may sit elsewhere in the system.
Finally, investigate the hours behind the percentage. A two-point availability gap caused by repeat hydraulic failures requires a different response from a gap caused by long planned services or network interruptions.
The objective is not to report the highest number. It is to recover productive hours without compromising safety or maintenance quality.
Keep Every Downtime Category Visible With AIM
AIM by HonestDig connects equipment status, maintenance events and production activity in one operational view.
It keeps planned maintenance, unplanned failures, operational delays and technology faults visible as separate states. This helps prevent reported availability from improving simply because delays were transferred into an excluded category.
Teams can see where capacity is being lost, what the loss is doing to production and which intervention should receive priority. This creates a more reliable basis for reducing unplanned equipment downtime.
Schedule a demo to see how AIM connects equipment availability with real production impact.
Frequently Asked Questions
What is a good equipment availability percentage in mining?
For mature large mining equipment, 88% to 92% physical availability is a practical reference range. The correct target depends on equipment age, asset class, operating conditions and the downtime included in the calculation.
Is 90% availability good for a haul truck fleet?
Yes. A consistently measured 90% is strong for many mature haul fleets. Confirm that planned maintenance, unplanned failures and relevant technology downtime are included before comparing it with another operation.
Do copper, coal and iron ore mines have different availability benchmarks?
They can use similar reference ranges, but they should not interpret them identically. Copper pits may face altitude and longer hauls, coal mines often divide owner and contractor fleets, and iron ore operations must account for autonomy and the wider mine-to-port chain.
What is the difference between availability and utilisation?
Availability measures whether equipment is capable of operating. Utilisation measures whether available equipment is actually working. A truck can be available but not utilised because it is waiting for an operator, loader or assignment.
Should planned maintenance count as downtime?
It should count in physical availability when the equipment is unavailable during scheduled operating time. Mines may exclude it from certain mechanical-availability calculations, but the reporting method must be stated clearly.
Can very high equipment availability be a warning sign?
Availability above 94% is possible, particularly for newer fleets. It should still be reviewed carefully because planned work, technology faults or other downtime may have been excluded from the calculation.