Mining Equipment Maintenance KPIs to Track
Learn which mining equipment maintenance KPIs matter, including OEE, MTBF, MTTR, PM compliance, availability, utilization, and work order cycle time.
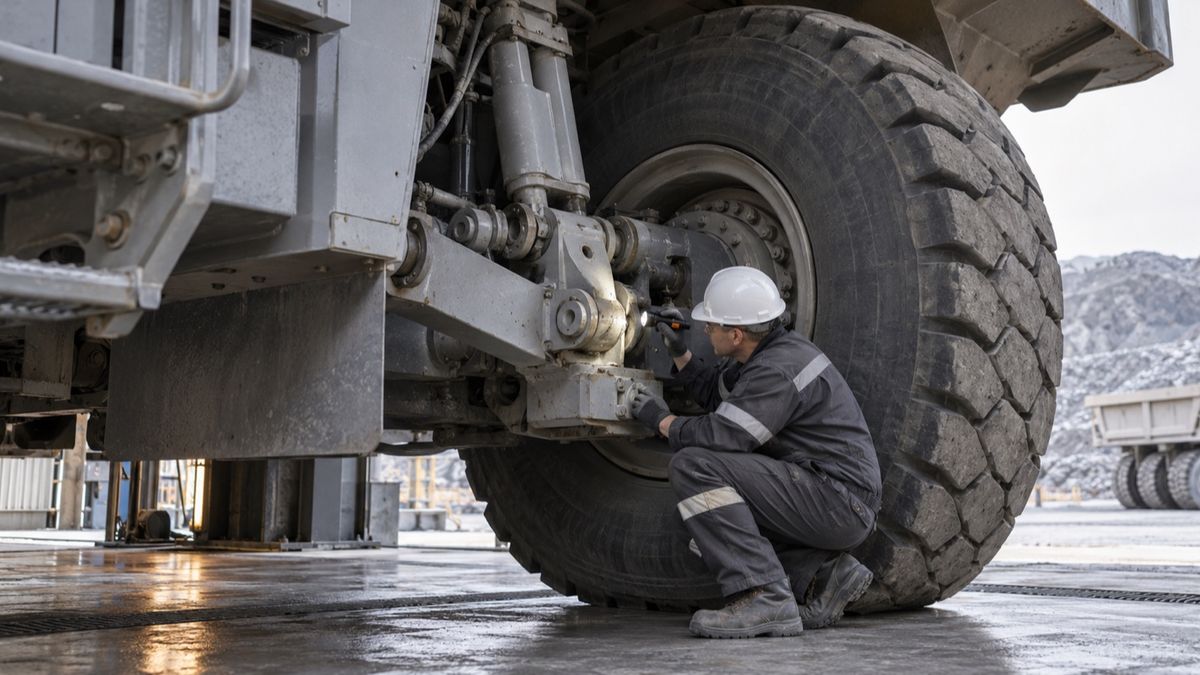
Mining Equipment Maintenance KPIs Every Operations Team Should Track
Last quarter, I watched a maintenance superintendent present what looked like a flawless dashboard to the GM.
PM compliance at 78%. Equipment availability at 89%. OEE holding at 68%. Everyone nodded.
Two weeks later, the primary gyratory crusher went down for 11 days, costing the site roughly $4.2 million in lost throughput.
The KPIs said everything was fine. The crusher disagreed.
That gap between what your numbers say and what your equipment actually does is where most mining operations bleed out. And it is not because the KPIs are wrong. It is because of how they are tracked, interpreted, and acted on.
By the end of this guide, you will know exactly which mining equipment maintenance KPIs matter, how to verify they are telling the truth, and what to do when your data is lying to you.
Before You Start: The Readiness Check
You need three things locked down before any of this is useful:
- A functioning CMMS or EAM with at least six months of work order history. It does not need to be clean yet, just populated.
- Defined downtime codes that your supervisors actually understand and use consistently.
- Access to production data, including tonnes moved, hours operated, and planned versus actual output at the asset level.
Stop or go test: Can you pull a single asset’s failure history, downtime log, and maintenance cost for last month in under 10 minutes?
If yes, keep reading.
If no, fix your data access first.
Fragmented maintenance and production information is one reason traditional systems struggle to explain site-level performance. HonestDig examines this gap in Mining Fleet Management Software vs Mine Operations Intelligence.
Start With the Core Five Maintenance KPIs
These are non-negotiable. Every mining maintenance operation needs these running before anything else.
1. Overall Equipment Effectiveness
Set up OEE tracking for each asset class.
Break it into Availability, Performance, and Quality for shovels, trucks, crushers, and mills separately. Do not average them into one site-wide number. That hides everything.
A site-level OEE average can look healthy even when a critical crusher, shovel, or haul fleet is deteriorating.
The calculation is:
OEE = Availability × Performance × Quality
The exact definition of Quality may need to be adapted depending on the asset. For processing equipment, it may relate to acceptable output. For mobile mining equipment, the operation may need to use payload compliance, productive output, or another suitable measure.
2. Mean Time Between Failures and Mean Time to Repair
Establish MTBF and MTTR baselines.
Pull 12 months of failure data and calculate both metrics by asset type.
MTBF = Total Operating Time ÷ Number of Failures
MTTR = Total Repair Time ÷ Number of Repairs
Industry ranges for excavators sit around 400 to 600 hours MTBF. If your haul trucks dropped from 820 to 580 hours, like one fleet I reviewed last year, you have a PM execution problem, not a PM scheduling problem.
MTBF shows how often an asset fails. MTTR shows how quickly the maintenance team restores it.
Neither metric should be reviewed in isolation.
A stable MTTR does not help much if failures are becoming more frequent. A high MTBF can also hide long repair times when a failure eventually occurs.
The wider operational impact of reliability problems is covered in The Real Cost of Unplanned Equipment Downtime in Mining.
3. Planned Maintenance Percentage
Measure your Planned Maintenance Percentage.
PMP tells you how much of your maintenance effort is proactive versus firefighting.
PMP = Planned Maintenance Hours ÷ Total Maintenance Hours × 100
If you are sitting at 52% on your underground fleet, you are still running a reactive shop. The target is 70% to 80% planned.
A high PMP does not automatically mean the maintenance strategy is effective. The planned tasks still need to address the failure modes affecting the equipment.
HonestDig’s analysis of the hidden costs of reactive maintenance explains how repeated firefighting affects production, labor allocation, and equipment reliability.
4. Preventive Maintenance Compliance
Track PM Compliance weekly, not monthly.
Monthly reporting lets missed PMs hide in averages. Weekly reporting forces accountability.
PM Compliance = PM Work Completed on Time ÷ PM Work Scheduled × 100
PM compliance should also be reviewed alongside schedule compliance. A maintenance team may prepare the work correctly, but the PM will still be missed if operations does not release the equipment.
5. Maintenance Cost per Operating Hour
This KPI shows how much maintenance spending is required for each hour an asset operates.
Maintenance Cost per Operating Hour = Total Maintenance Cost ÷ Asset Operating Hours
Compare it with MC/RAV targets and review it alongside MTBF and repeat failures. A low cost per hour means little if reliability is declining.
Your dashboard should also show Availability, Performance, Quality, MTBF, and MTTR by asset class. If a manual OEE calculation differs from the system by more than 10%, review the downtime codes and cycle-time assumptions.
Add the Operational Intelligence Layer
Once the core five are solid, add the KPIs that explain what is happening around the maintenance event.
Equipment Availability vs Mechanical Availability
These are not the same thing.
Mechanical availability on your primary gyratory might be 89%, but if physical availability is only 76% because of operational delays, blaming maintenance is the wrong call.
Track both and separate them in your reporting.
Mechanical availability focuses on whether the asset is mechanically capable of operating. Physical or operational availability may also account for delays, scheduling, labor, access, and other site conditions.
This distinction matters because maintenance teams are often blamed for lost production that originated elsewhere in the operation.
Work Order Cycle Time
This is the KPI most teams ignore.
MTTR only measures wrench-on to wrench-off. It completely ignores planning, parts waiting, and approval queues.
If your cycle time for critical bearing changes is 14 days but MTTR shows four hours, you are measuring the wrong thing.
Track the process from fault report to technical close.
Work Order Cycle Time = Technical Close Time − Fault Report Time
The difference between repair time and total cycle time reveals delays in planning, permits, approvals, parts, labor allocation, and equipment access.
Reactive vs Planned Maintenance Ratio
If you are at 65% reactive, you already know the problem.
But here is what most guides will not tell you: flipping that ratio is not only a maintenance problem. It is a scheduling compliance problem.
When operations keeps moving maintenance jobs to protect short-term production, your MTBF declines regardless of how good your PM program is.
Schedule compliance at 63% kills reliability. Full stop.
A more connected view of production and maintenance is central to Predictive Site Resilience, where operational disruptions need to be identified before they become prolonged site losses.
Asset Utilization Rate
When your 785 haul trucks are sitting idle 42% of the time, that is not a maintenance KPI issue on its own.
But when utilization exceeds 85% and MTBF drops below benchmark at the same time, you are pushing assets beyond their sustainable operating limits.
Build a correlation dashboard that flags this automatically.
Asset Utilization = Productive Operating Hours ÷ Available Hours × 100
Utilization should also be reviewed alongside haul truck idle time, dispatch performance, and equipment availability. Otherwise, the maintenance team may be held responsible for idle periods caused by loading, queueing, shift changes, or poor fleet allocation.
Visual checkpoint: Your work order backlog board should show clear status colors. Red for overdue, yellow for in progress, and green for complete.
Your downtime code summary should show failure-related downtime as a minority of total downtime.
If reactive work still dominates the board, the core KPI setup is not complete.
Verification: Pick five recent failures from your CMMS. Each should have a clear failure code, start time, and end time.
If two or more are miscoded or missing timestamps, stop and run a downtime taxonomy audit before trusting any KPI built on that data.
Audit the KPIs for Hidden Errors
This is where it gets uncomfortable.
Your mining equipment maintenance KPIs can all look green while the operation is deteriorating. Here is the troubleshooting table I keep coming back to:
Problem | Practical Check or Response |
|---|---|
OEE looks good but production falls short | Run a Shadow OEE using actual historical cycle times rather than ideal cycle times. Compare the gap. Operators padding cycle times to hit targets is more common than anyone admits. |
MTBF and MTTR remain stable but unplanned downtime increases | Run a two-week manual review of downtime codes. Some failures may be logged as planned work or operational delays. Create a clear failure-versus-delay taxonomy and retrain supervisors. |
PMP is high but equipment still breaks | Map PM tasks to actual failure modes. You may find that a portion of planned work is low-value checklist maintenance. Reallocate those hours to condition-based tasks. |
PM Compliance is high but MTBF is low | Spot-check 10% of completed PMs with a senior mechanic. Technicians signing off without completing the work is a real issue. Tie PM audit scores to supervisor KPIs. |
Maintenance cost per hour is low but reliability is poor | Cross-check CMMS hours against payroll and inventory. Off-book repairs and unreported overtime may be distorting the cost picture. |
Work order cycle time is long but MTTR is short | You are only measuring active repair. Track the process from fault report to technical close. The waste is likely in planning, parts waiting, or approvals. |
Utilization is high and MTBF is low | Flag assets where utilization exceeds 85% while MTBF remains below benchmark. Your First-Time Fix Rate will help identify whether over-utilization is contributing to repeat failures. |
The pattern is consistent: dirty data and weak process discipline silently distort every KPI downstream.
A Reliability-Centered Maintenance approach helps determine which components justify condition-based monitoring and which should remain on time-based preventive maintenance. But RCM only works if the underlying failure, downtime, and work order data is trustworthy.
The same principle applies to broader mining AI programs. HonestDig’s article on why most mining AI projects fail before reaching production shows why unreliable operational data can undermine even technically strong systems.
When Your KPIs Need a Single Source of Truth
Most of the hidden errors above trace back to one root cause: fragmented systems and manual data reconciliation.
AIM by HonestDig connects maintenance, production, and fleet data in a single real-time platform, so your OEE, MTBF, availability, and downtime codes are calculated from the same operational truth.
If you are running Predictive Site Resilience programs or working toward Guaranteed Production Throughput, unified data is not optional.
Mining teams also need to move beyond basic dashboards. Real-time operational intelligence helps connect equipment performance with production conditions, workforce availability, and current site constraints.
For mobile fleets, this also means connecting maintenance information with AI-driven mine dispatch so unavailable or deteriorating equipment does not continue affecting truck assignments and production plans.
See how AIM supports open-pit mining operations by bringing fleet, equipment, production, and operational information into a more connected decision-making environment.
Frequently Asked Questions
How long does it take to establish reliable maintenance KPI baselines?
Plan for a minimum of 90 days with clean data capture. Most sites need a two-week downtime code audit upfront, followed by 60 to 90 days of disciplined CMMS entry before MTBF and MTTR trends become trustworthy enough to act on.
What is a realistic OEE target for mining equipment?
Industry benchmarks for mining OEE sit around 60% to 65% for heavy mobile equipment. If your dashboard shows 75% or higher, audit your cycle-time assumptions before celebrating. Shadow OEE calculations often reveal a 10 to 15-point gap from the official number.
Should safety KPIs be tracked alongside maintenance KPIs?
Yes. TRIFR and LTIFR should sit on the same dashboard.
Unscheduled downtime consuming 22% of planned production time often correlates with rushed reactive repairs, which is where safety risk can increase.
Teams managing Autonomous Workforce Governance alongside maintenance planning can see this connection more clearly when workforce, compliance, and equipment data are reviewed together.
How do we stop operations from repeatedly moving maintenance schedules?
Tie schedule compliance to production outcomes visually.
When leadership sees that 63% schedule compliance directly correlates with declining MTBF and rising unplanned downtime, the conversation shifts.
A unified operations platform makes this correlation visible in real time rather than burying it in monthly reports.
What is the difference between equipment availability and utilization?
Availability measures whether an asset is capable of operating. Utilization measures how much of that available time is actually used productively.
An asset can have high availability and low utilization because of queueing, workforce shortages, dispatch decisions, operational delays, or changes in the production plan.
Which maintenance KPIs should be tracked first?
Begin with OEE, MTBF, MTTR, Planned Maintenance Percentage, PM Compliance, and Maintenance Cost per Operating Hour.
Once these metrics are reliable, add equipment availability, utilization, work order cycle time, schedule compliance, backlog, and the reactive-to-planned maintenance ratio.
The Question Worth Asking
Are your KPIs measuring what is actually happening, or only what is being reported?
The answer usually lives in that 10% PM audit and the Shadow OEE calculation.
Start there.